
The Last Scarce Asset
2026-08-03
Robot foundation models train on orders of magnitude less data and compute than frontier LLMs. If they scale the way language models did, demand for real-world data grows by a similar factor — and that data has to be captured rather than scraped. This essay argues that decentralized capture networks are the supply model best matched to that demand, describes the 3D dataset OVER has built with one, and explains why falling costs for compute and research capability let a data owner do more than license.
Section 01
Demand: the scaling run hasn’t happened yet
The state of the art in physical AI trains on a small fraction of frontier-LLM compute. OpenVLA, still a reference open vision-language-action model, used 64 GPUs for two weeks; Grok 3 pre-trained on more than 100,000. The gap between a frontier LLM run and a state-of-the-art robot foundation model is three to four orders of magnitude.
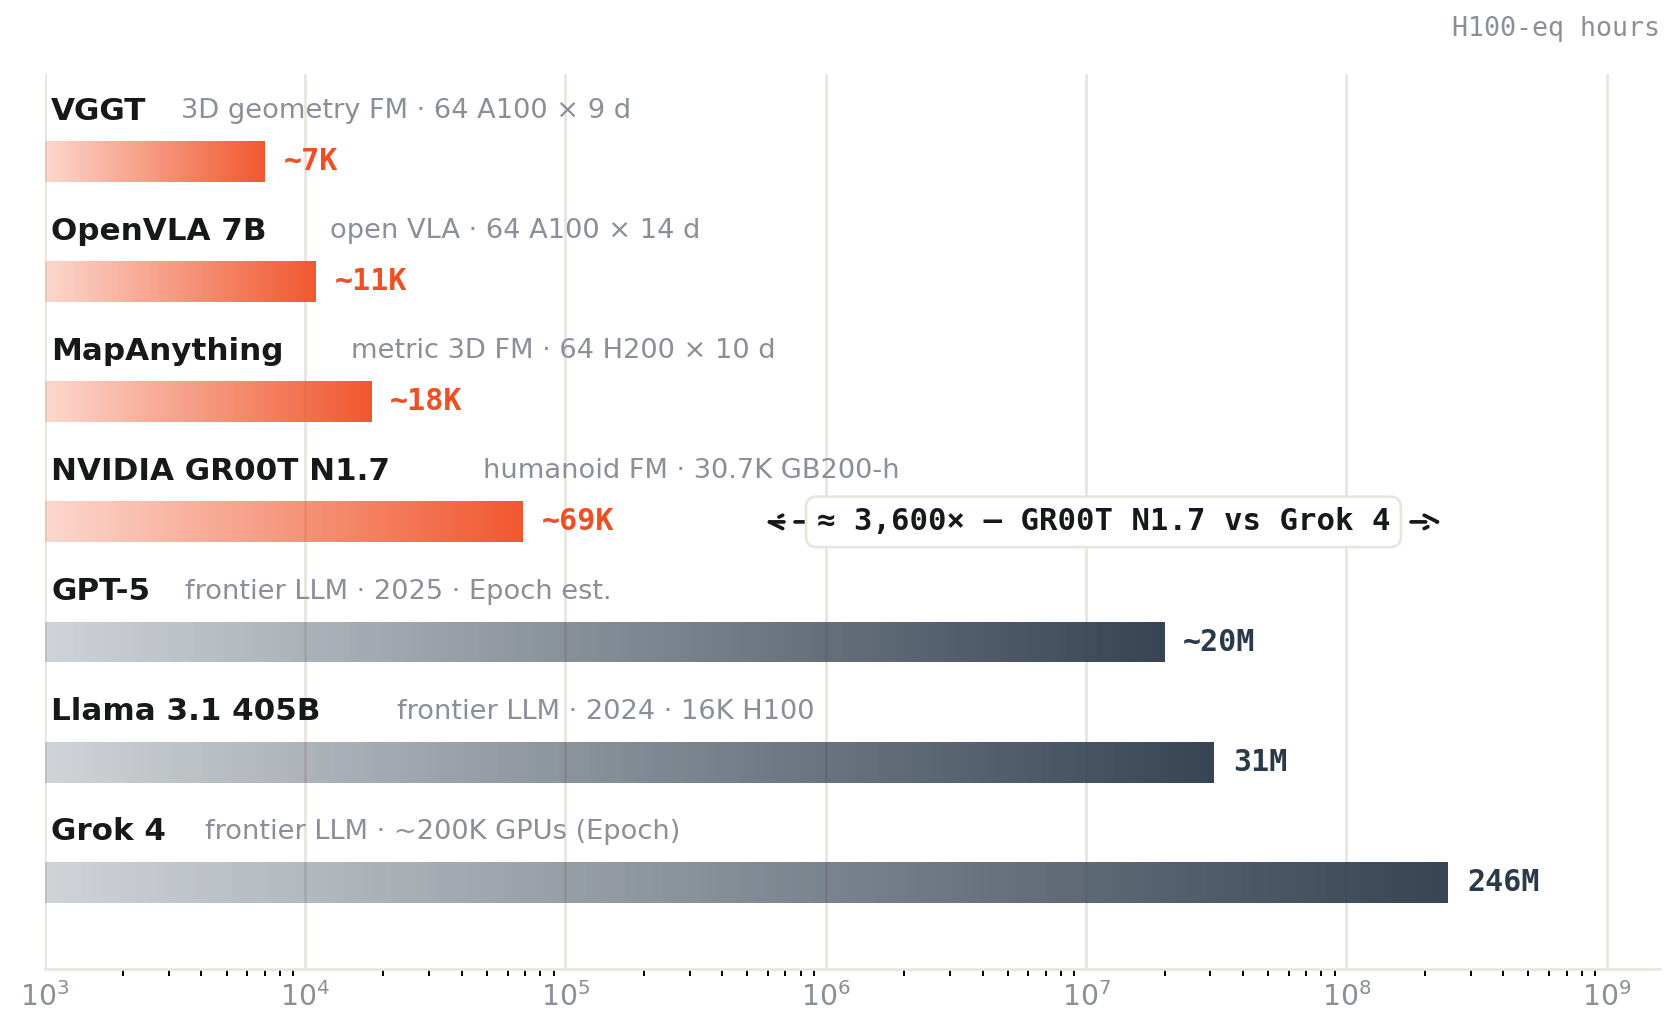
Two constraints keep these models small. The architectures are still maturing, and — the more binding limit — there isn’t enough data to train anything bigger. OpenVLA cycles through its entire dataset 27 times during training, where frontier LLMs see most of their data once. With small datasets, models stay small, and small models need little compute. By LLM standards, the field is still early.
The conditions for a scaling run are forming. DeepMind ships Gemini Robotics; NVIDIA has named robotics its next major market and presented a “Physical AI Data Factory” blueprint at GTC 2026; OpenAI is rebuilding its robotics program; robotics startups have raised $18.8B so far in 2026, more than in all of 2025. If architectures mature enough to absorb LLM-scale compute, balanced scaling implies data demand rises by roughly the same orders of magnitude: closing even half the current gap would require real-world data at 100–1,000× today’s entire public supply. Labs are already buying — XDOF launched with $70M and around 20 customers including frontier labs, General Intuition raised at a $2.3B valuation, and Tesla keeps more than 1,000 Optimus units in-house primarily to collect data.
Section 02
Supply: why physical data is scarce
Language models benefited from an unusual inheritance: thirty years of human activity already transcribed onto scrapeable servers. The indexed web holds roughly 500 trillion tokens, and it cost model builders nothing to accumulate. Nothing comparable exists for the physical world. The geometry of a street, or the way a door handle responds to force, was never uploaded anywhere; it has to be captured, sensor by sensor and place by place, at real marginal cost.
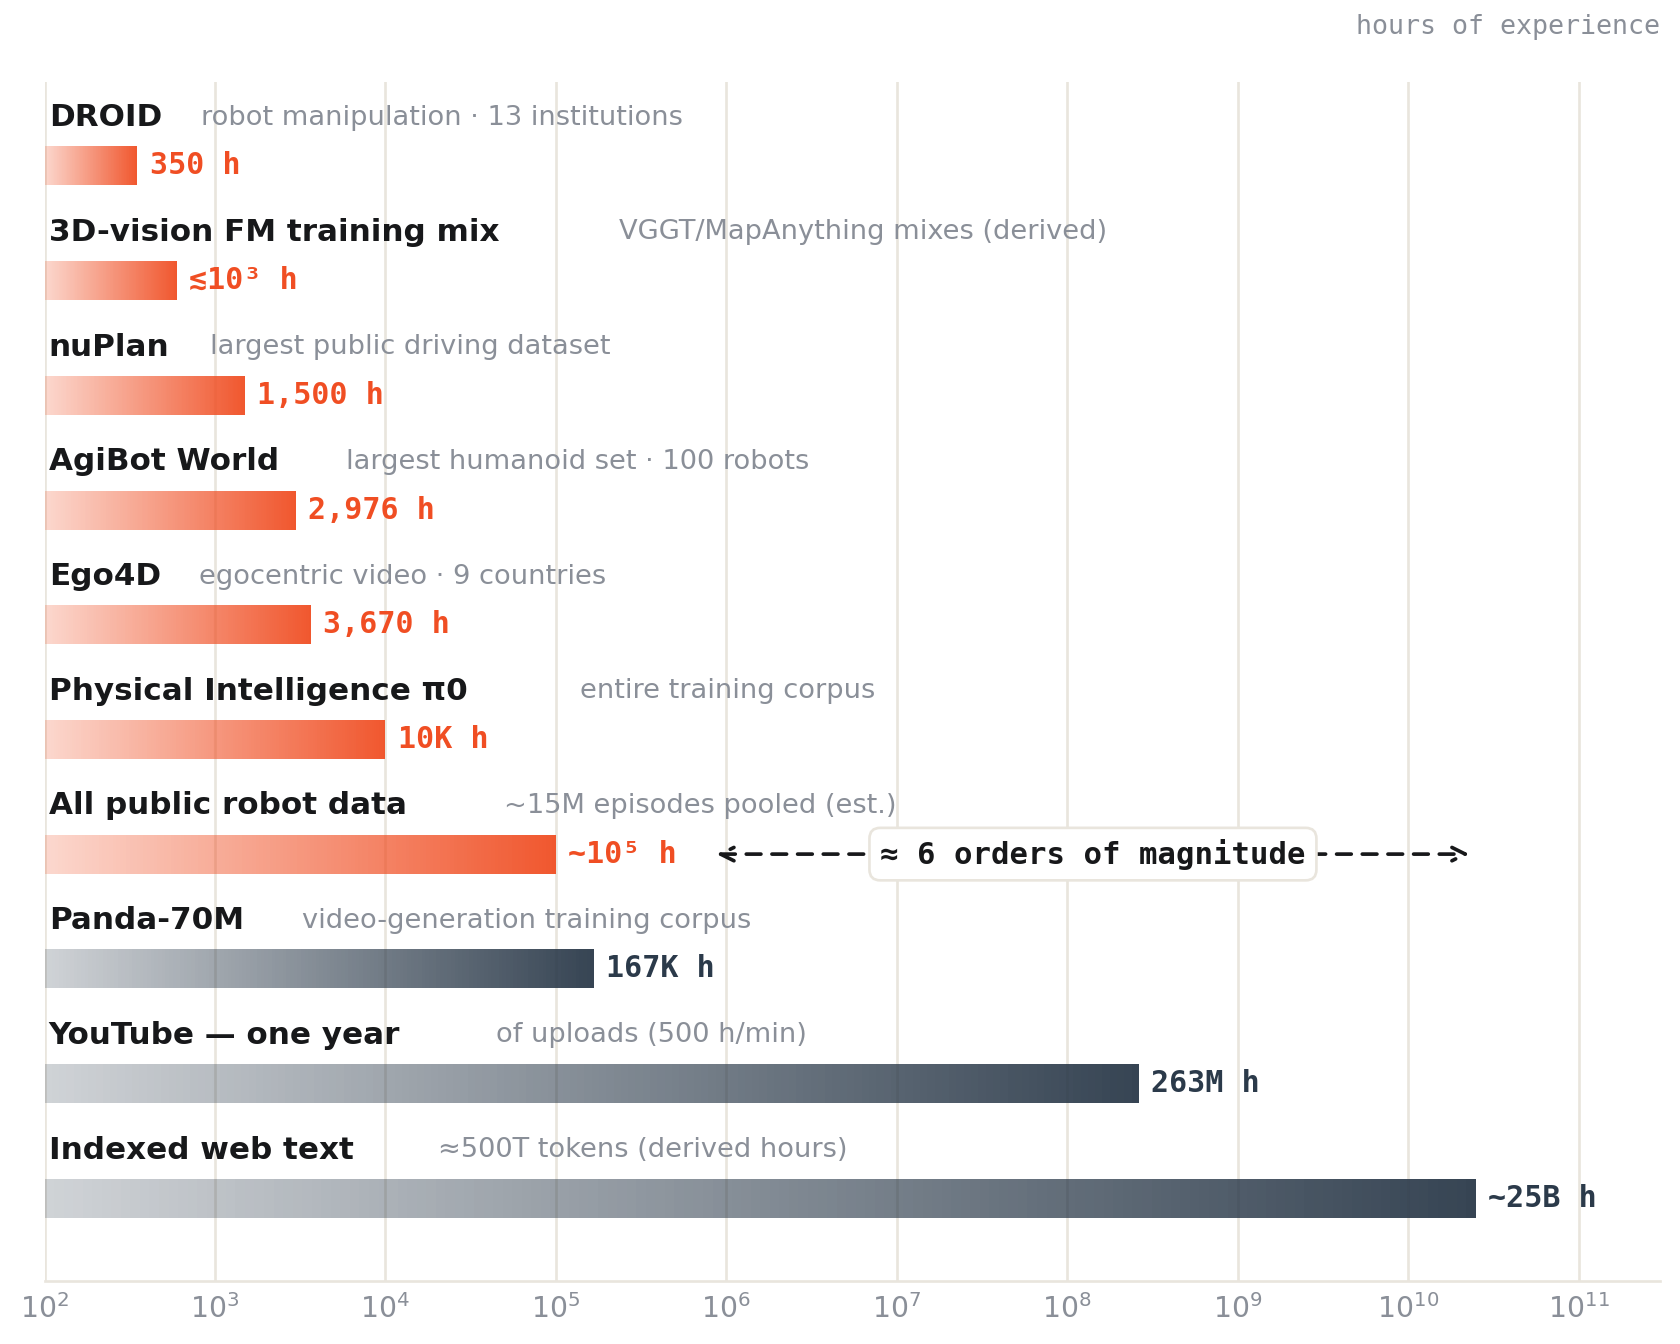
The largest humanoid dataset assembled so far — AgiBot World, collected by 100 robots in a purpose-built Shanghai facility — totals 2,976 hours. YouTube receives that much video every six minutes. Web video is also not a substitute: Meta’s V-JEPA 2 pre-trained on a million hours of it and still needed real robot data for control, because video lacks metric scale, 3D geometry, and action labels.
The chart also leaves out the datasets that built 2D vision — ImageNet’s 14 million images, LAION’s 5.85 billion image-text pairs — because they’re measured in images rather than hours of experience. Meanwhile, the corpora behind today’s 3D-vision foundation models (VGGT, MapAnything) amount to under roughly 1,000 hours-equivalent of real capture.
One empirical result matters for what kind of data to collect. The most careful scaling study in robot learning found that policy generalization follows a power law in the diversity of environments and objects, not in the number of demonstrations collected in any one place. The binding constraint is coverage — many places, many objects, many conditions, refreshed over time — more than raw hours. The sections above cover demand; the rest of the essay is about supply.
Section 03
Four ways to capture reality
If demand develops as argued above, the practical question is how to capture physical data at scale. Four supply models exist today, with very different cost curves.
| Supply model | Who bears capex | Marginal cost of a new place | Environmental diversity | Freshness | Examples |
|---|---|---|---|---|---|
| Corporate fleet | The company — cars, sensors, drivers | High — a vehicle trip per location | Follows corporate priorities; rich-world bias | ~1 pass every 1–2 years | Google Street View: 2007–2019 to reach 16.1M unique km |
| Robot fleet | The company — billions in hardware | Very high — a deployed robot | Single embodiment; facility- and task-bound | Continuous, but narrow | Tesla keeps 1,000+ Optimus units in-house primarily for data |
| Teleop / data farm | The company — facilities & operators | Linear — $136–340 per operator-hour | Limited to staged facilities | On demand, at cost | XDOF ($70M launch, ~20 lab customers), AgiBot’s 4,000 m² plant |
| DePIN network | Contributors — capex moves to the edge | Near zero — token emission + validation | By construction — supply appears wherever people live | Steerable — rewards boosted where data is stale | Helium, Hivemapper, OVER |
The first three models share the same limitation: cost scales with coverage. Every new neighborhood is another vehicle trip, another robot, another operator-hour. But coverage — environmental diversity — is exactly what the scaling results reward. Only the fourth model avoids this tension.
Section 04
Why DePIN’s cost curve is different
Decentralized Physical Infrastructure Networks approach capture with an incentive instrument instead of a fleet: a token that converts the network’s future demand into present supply. Contributors buy their own sensors, capture where they live, and are paid in upside tied to the network; the company’s marginal cost for a new location drops to validation and storage. Capex doesn’t disappear — it moves to the edge, spread across thousands of participants who each hold a stake in what they’re building.
There is now a track record to evaluate. Messari counts over 650 DePIN projects and 8.8 million active devices, with a growing share of the sector generating real revenue. Two precedents are most relevant. Helium bootstrapped a global wireless network to roughly one million IoT hotspots — infrastructure that would have cost a telecom billions in capex — by paying contributors in tokens to run radios at home. Hivemapper is the closest precedent for mapping: its dashcam network went from 2% of the world’s roads in March 2023 to 20% within eighteen months, and to roughly a third today. The company reports coverage growth about five times faster than Google Street View achieved with corporate fleets, with over 100 repeat passes where Street View averages one every year or two. These figures are company-reported, but even discounted they suggest decentralized capture can outpace fleets on coverage and freshness.
Token incentives reach places no fleet is ever dispatched to.
Three properties make DePIN a good fit for physical-AI data. First, diversity by construction: supply appears wherever contributors live, which matches the environment-diversity pattern the scaling results reward. Second, steerable supply: token rewards act as a dial, so a demand signal from model training — more indoor retail, more rain, more night scans — becomes a reward boost, and the network re-targets within days. Third, freshness: contributors re-scan because earning is continuous, so the corpus becomes a time series of places rather than a one-pass archive.
The main caveat: DePIN’s known failure mode is rewarding volume over quality. The mitigations are structural — validation before rewards vest, demand-side revenue that consumes supply, reward curves tuned to what training actually uses. The networks that survived the 2022–24 shakeout are the ones that built this discipline, and the sector’s compression from 1,000× to 10–25× revenue multiples suggests the market now prices fundamentals.
Section 05
What OVER has built
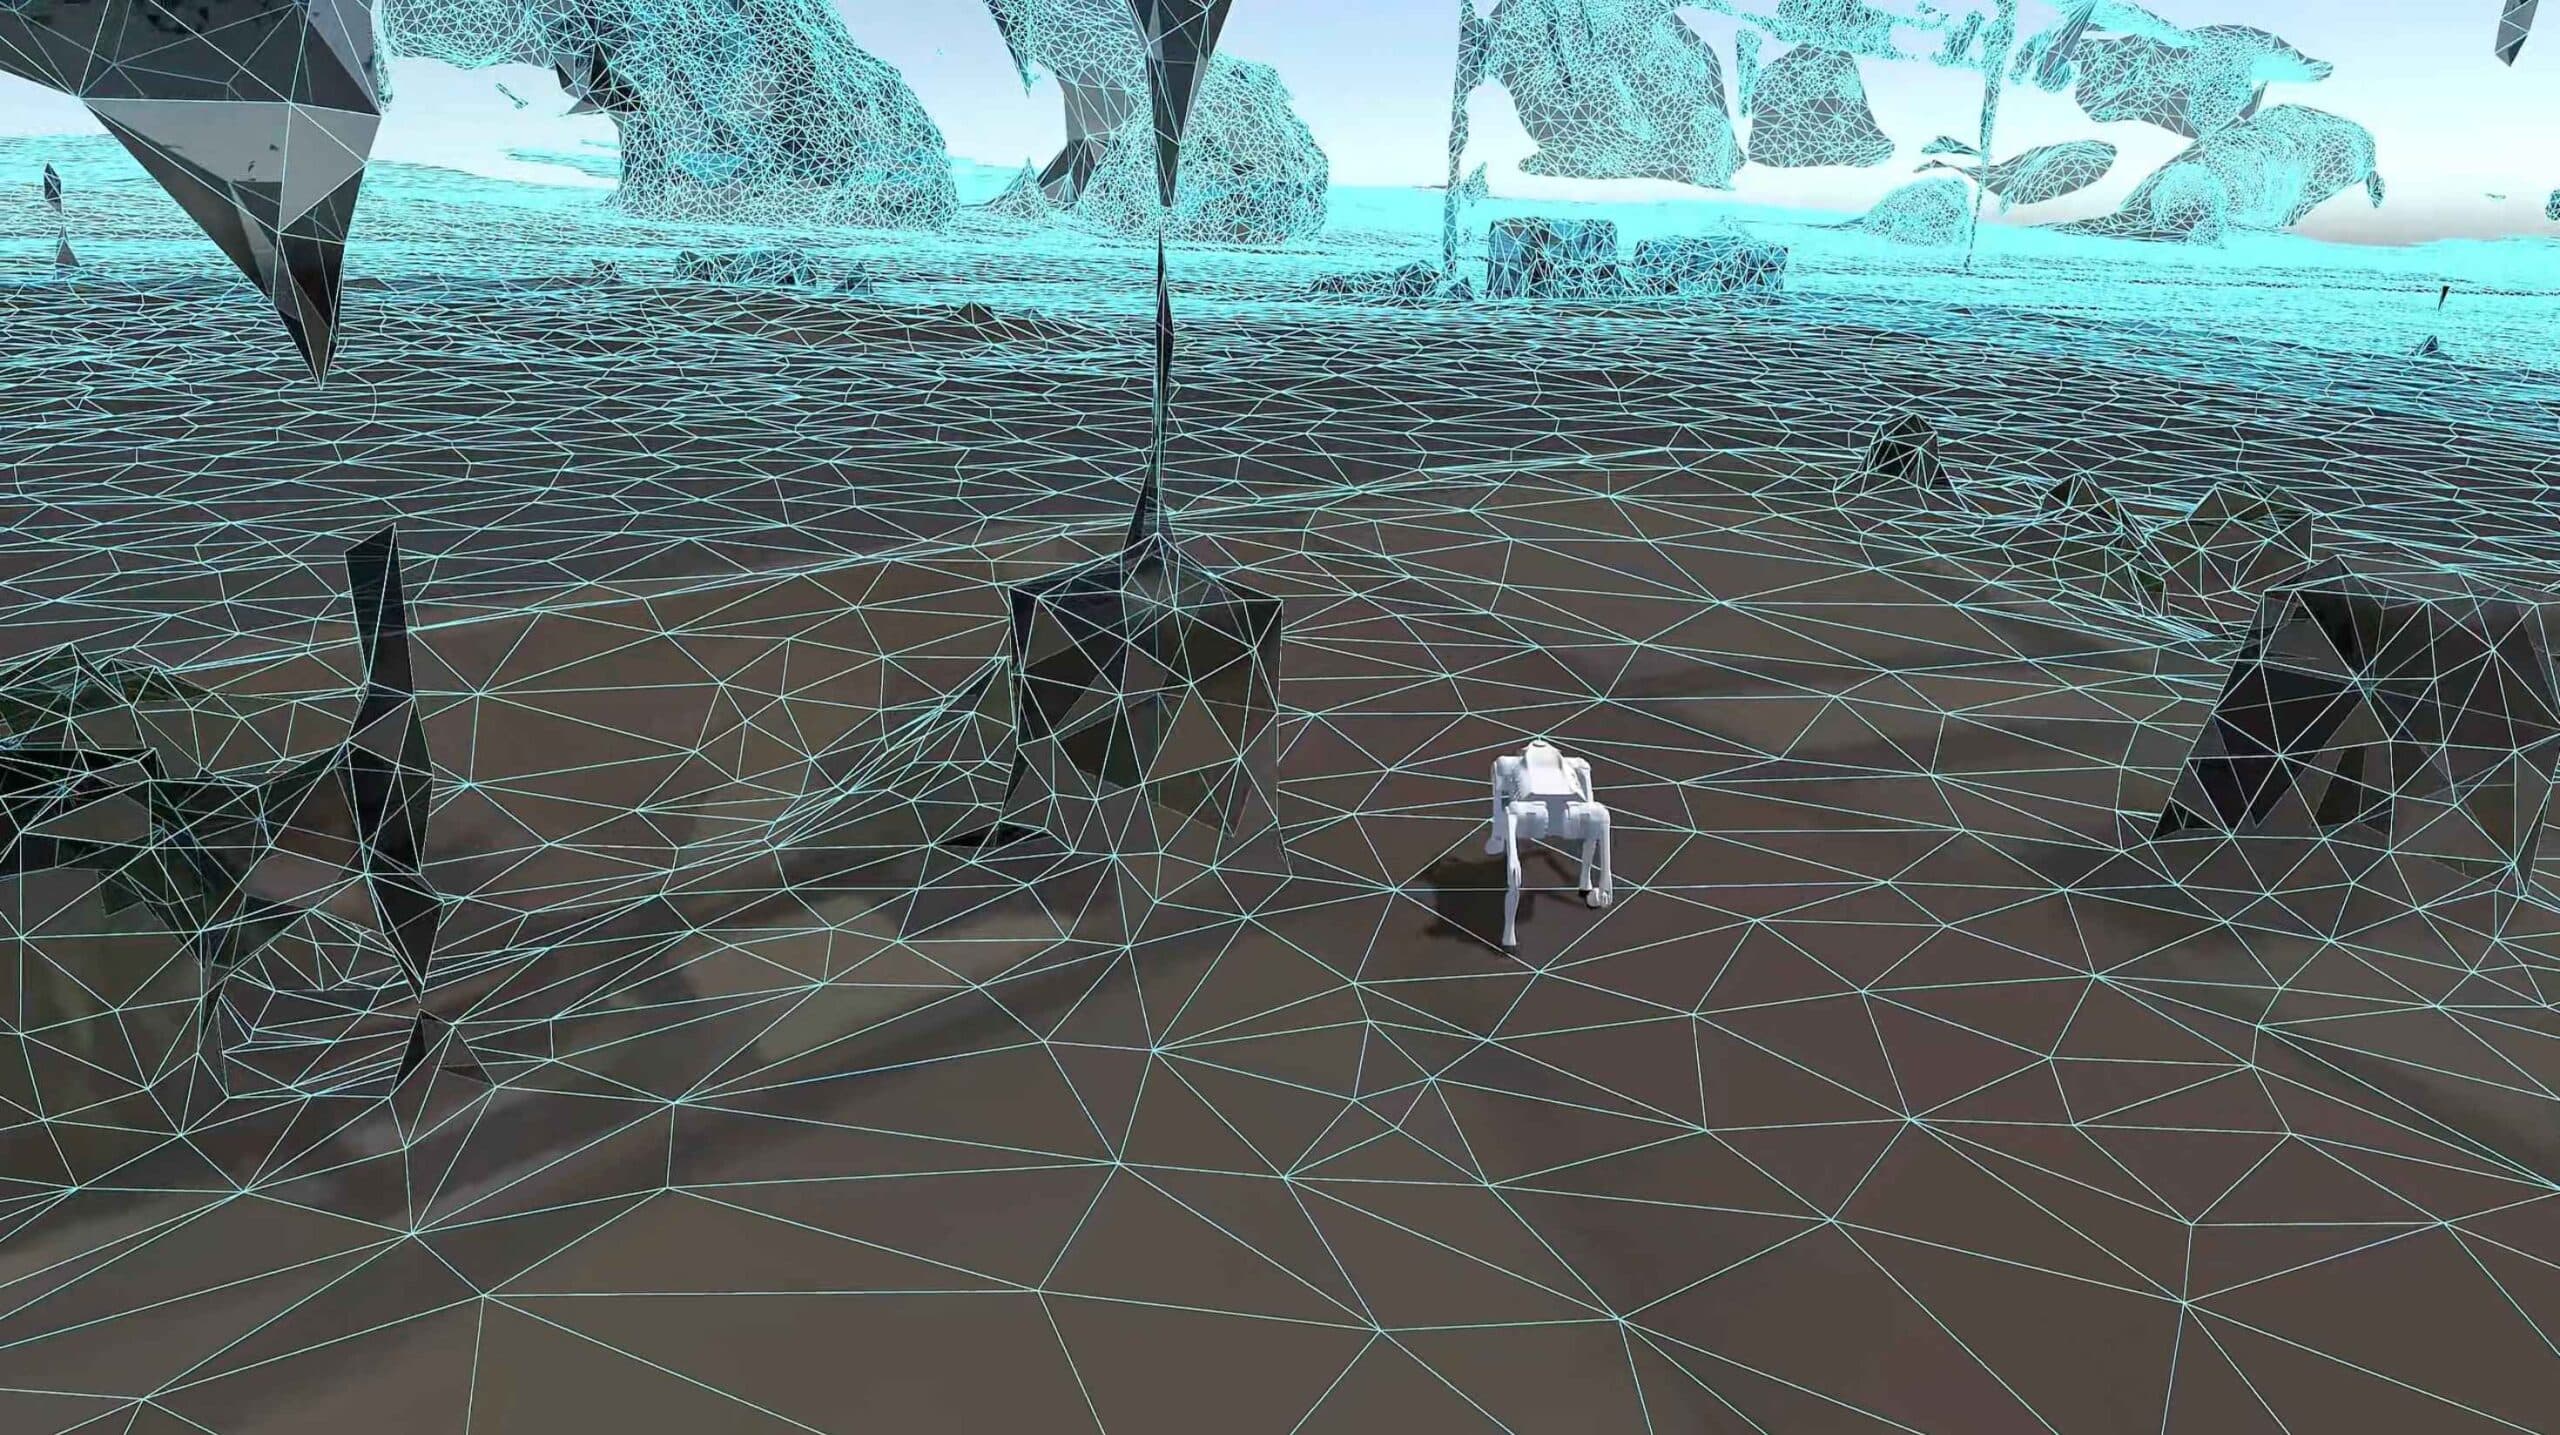
OVER has been applying this model to 3D mapping since well before the current physical-AI cycle, focused on metric-scale 3D reconstructions of real places rather than street video. Through Map2Earn, anyone with a smartphone can scan a location; the capture is validated, reconstructed into photogrammetry-grade 3D, and registered to the map, and the mapper earns OVR tokens. OVRLand — ownership of 300 m² spatial domains with publishing rights and revenue share — gives contributors a lasting stake in the network rather than piecework wages. The result is, to our knowledge, the largest crowdsourced 3D map:
What matters about this corpus is less its size than its labels. Every capture is a 3D reconstruction with metric scale, camera poses, and spatial registration — the supervision signals that world models, VLA navigation stacks, and sim-to-real pipelines lack in web video (the V-JEPA 2 result above). The same asset serves three kinds of demand: training data for world and geospatial models; digital twins that seed simulation pipelines such as NVIDIA’s data factories; and a live localization service — VPS with centimeter-grade, TEE-encrypted pose estimation — already consumed by robots as an API.
Token rewards
OVR emissions and OVRLand stakes recruit mappers wherever they live.
The world, scanned
Smartphone photogrammetry, validated into metric-scale 3D, without fleets or facilities.
Living 3D map
275K+ locations, re-scanned over time — a time series of real places.
LGMs & VPS
Large Geospatial Models and localization trained on the proprietary corpus.
APIs & data sales
Robotics, XR and enterprise demand pays the network, funding richer rewards.
The cost structure follows from the loop. Adding a location doesn’t require dispatching hardware; it requires adjusting a reward curve, because contributors already own the sensors. This is also why coverage is geographically scattered — Toronto, Bangkok, Charleroi, Nghĩa Trụ, Atlanta and Shenzhen all appear in a single month of scans — rather than following a deployment plan.
What licensing alone is worth
Suppose OVER only ever licenses this data. There are recent comparables for what markets pay when data is the bottleneck: Meta paid $14.3B for 49% of Scale AI (implying ~$29B); Surge, bootstrapped to $1.2B in revenue, has reportedly negotiated at $25–30B; Mercor went from $2B to $10B in eight months and is reportedly in talks at $20B. Those valuations are for companies that refine text scraped for free; physical-AI data is proprietary from the moment it’s captured. Licensing at anywhere near those comparables would be a solid business by itself. We think there’s additional upside, because of what happened to the other two inputs over the last year.
Section 06
Research capability is becoming rentable
Until about a year ago, this essay would have ended at licensing. Moving up the value chain required two things a data company couldn’t easily get: a frontier research team and a nine-figure compute budget. Compute went first: an H100-hour that cost over $8 at the 2023 peak rents for $1.50–2.50 today, and Stargate, Colossus, and Meta’s gigawatt campuses are pushing supply further. The research constraint is now easing too, and the change is measurable.
METR tracks the length of software and ML-research tasks (measured in expert-human time) that an AI can complete autonomously at 50% reliability — close to the actual work of training a foundation model. That horizon doubled roughly every seven months from 2019 to 2025; since January 2024, it has doubled about every 105 days.
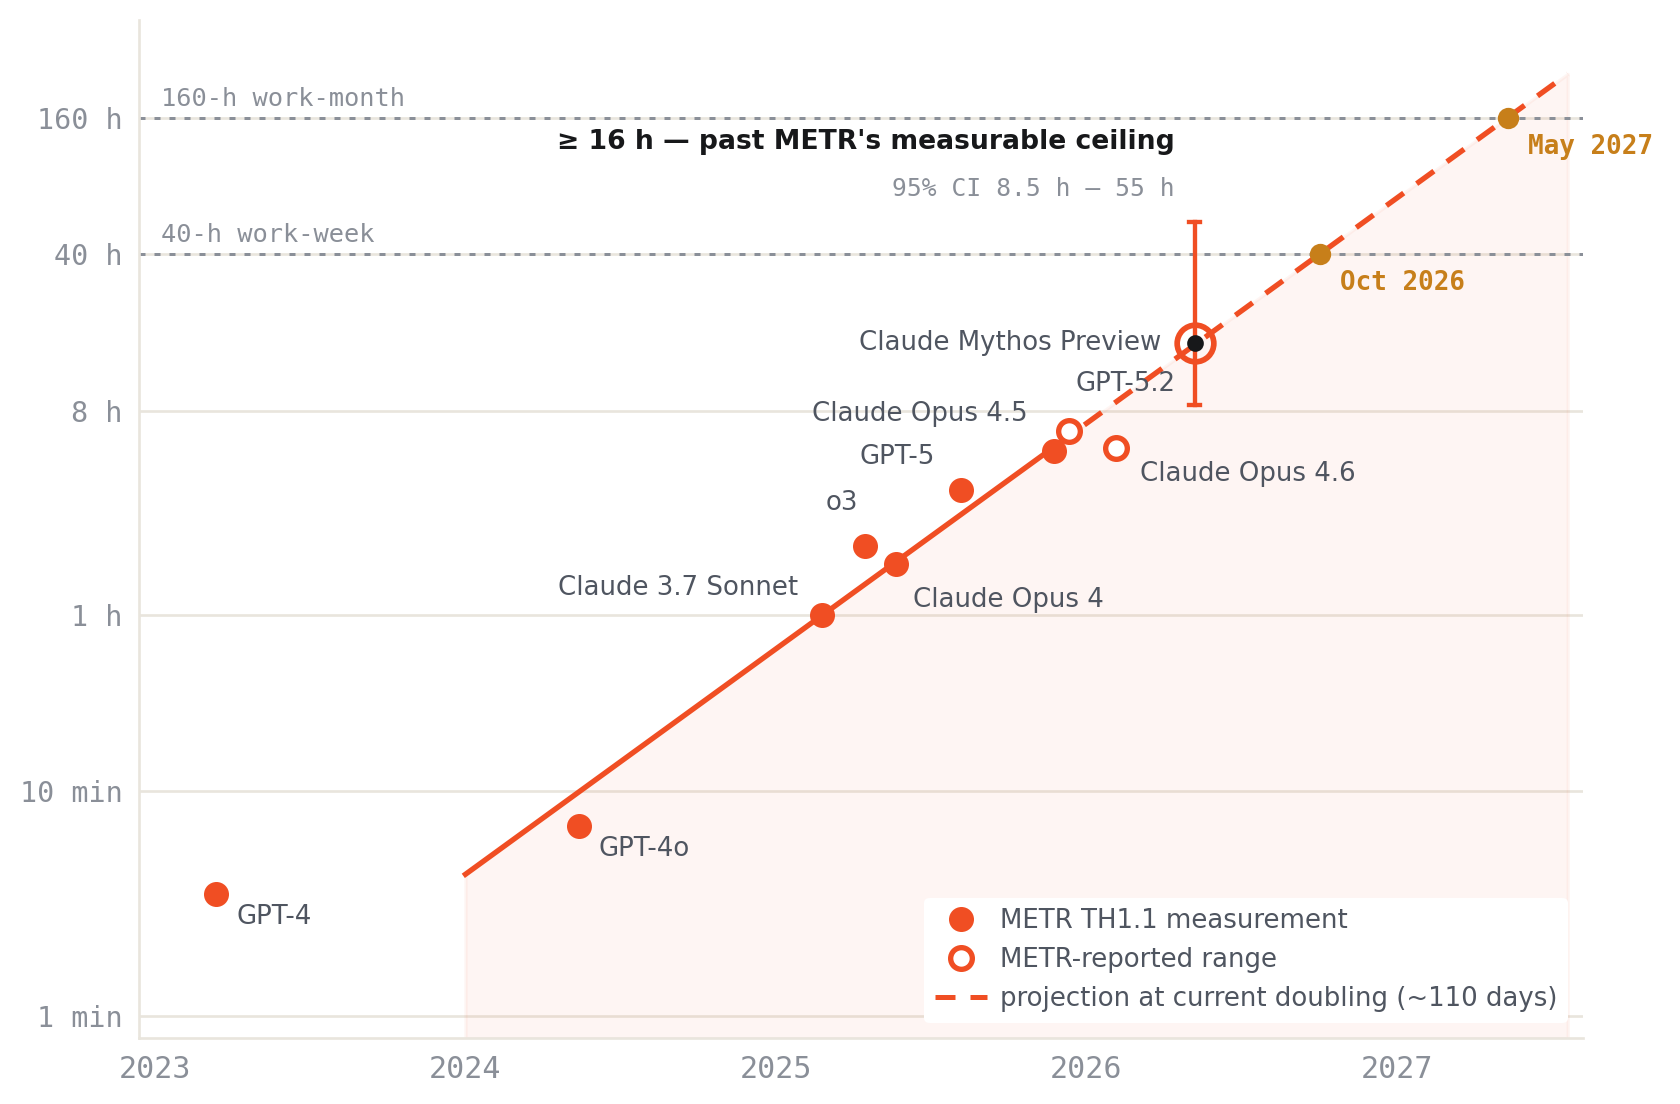
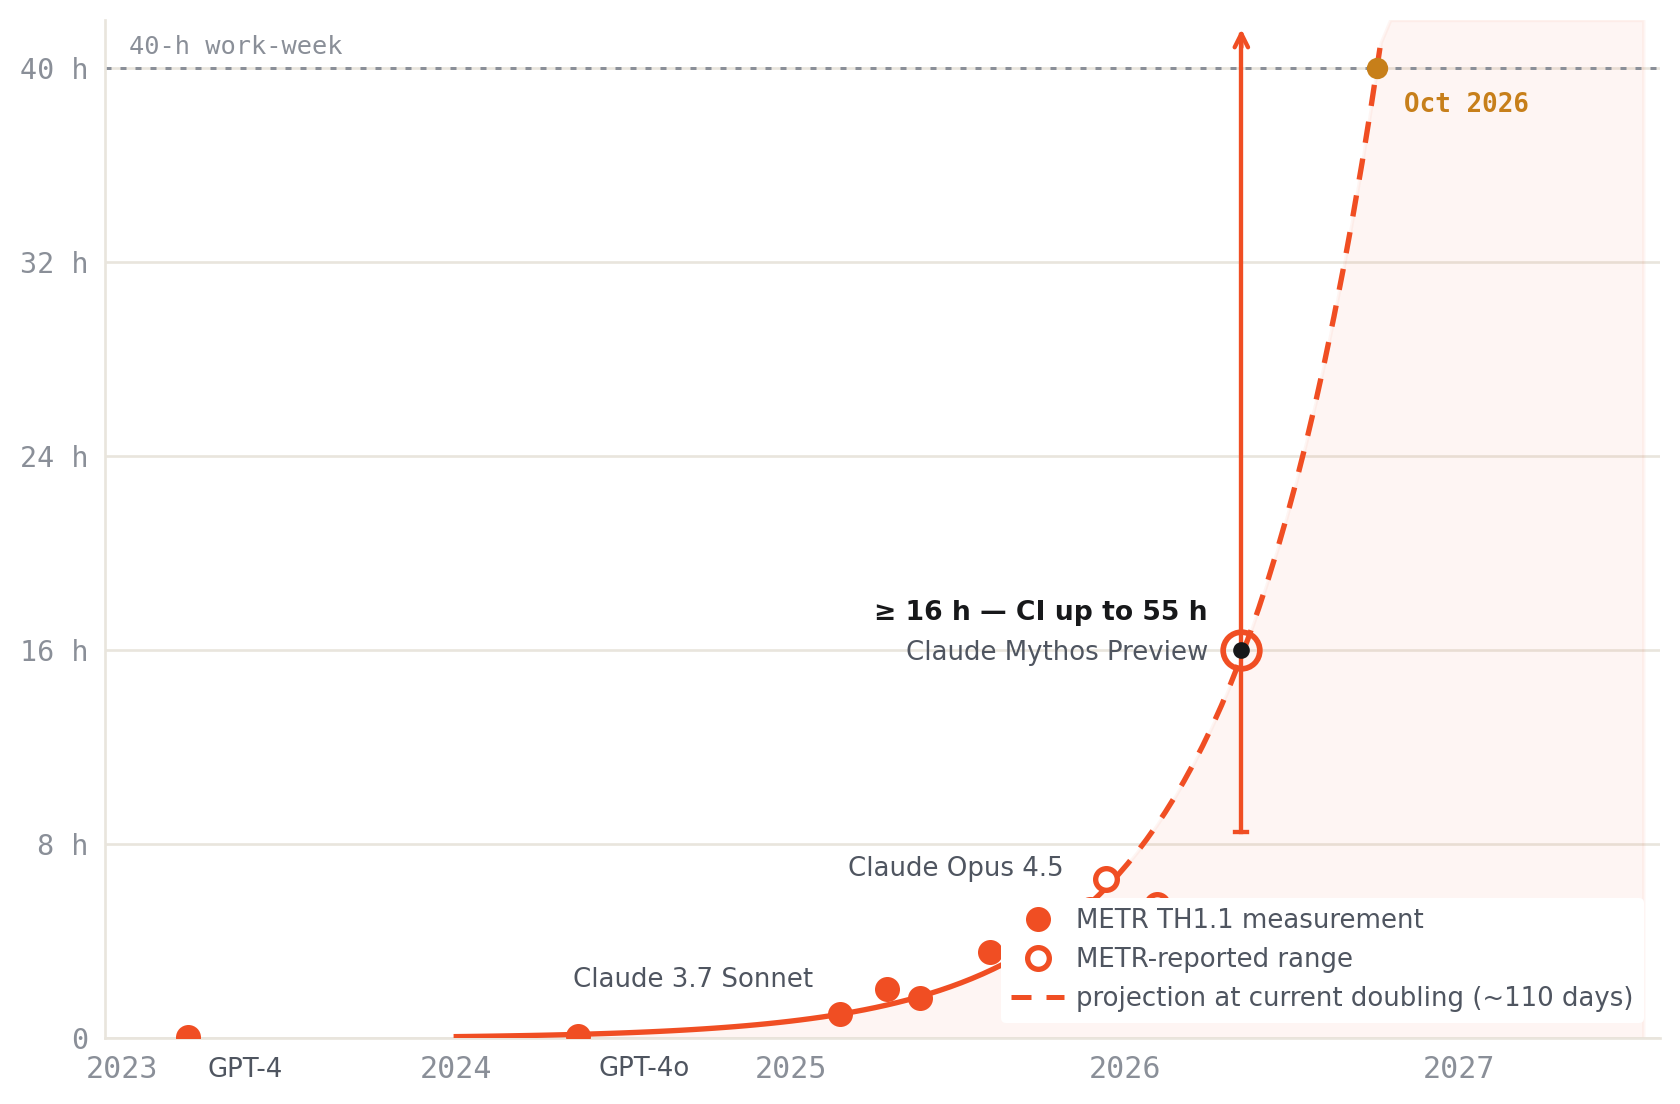
In May 2026, METR added Claude Mythos Preview — the model class behind Claude Fable 5 — and reported a horizon at or beyond 16 hours, past the range the current benchmark can measure reliably. Concrete examples of what this looks like in practice: Anthropic reports Mythos 5 running a week of largely autonomous research and producing an ML model that outperformed a recent Science-published model at a hundredth of the size; DeepMind’s AlphaEvolve improved on a 56-year-old matrix-multiplication result and recovers around 0.7% of Google’s global compute; on METR’s RE-Bench, AI agents score four times human experts at two-hour research budgets. On the open-weights side, Moonshot’s Kimi K3 — 2.8 trillion parameters, third on GDPval behind Claude Fable 5 and GPT-5.6 — rents at $15 per million output tokens, with the open-closed gap around 3–4 months and capability prices falling roughly 10× per year.
The specialized capability needed to train a state-of-the-art model — the scarcest input of the last decade — increasingly has a market price. To be clear, the claim is about market structure, not about human researchers becoming obsolete: the engineering capability required to train a competitive physical-AI model is ceasing to be a differentiator, because every serious team works with frontier research agents and training recipes diffuse through open weights within months. When an input is available to everyone at a price, it stops being a moat. The practical barrier between data vendor and AI lab — people and capex — is much lower than it was.
Section 07 · Conclusion
Three tiers of value
Taken together, the argument prices OVER’s position in three tiers. The demand and supply case justifies the first two on its own; the fall in research and compute costs opens the third — and the third is where foundation-model economics live.
License the data
Raw and curated 3D data, sold to labs facing the demand growth described above. Text-era comparables — Scale at ~$29B, Surge in talks at $25–30B, Mercor in talks at $20B — were built on refining freely scraped data; OVER’s data is proprietary from capture.
APIs on the same asset
VPS localization (centimeter-grade, TEE-encrypted, live on 273K+ locations), robotics endpoints, digital-twin feeds for simulation pipelines. Recurring, per-call revenue on the same asset.
Train models on the corpus
Large Geospatial Models and world models trained on the proprietary corpus, with compute rented by the hour and research capability rented by the token. Labs without proprietary data compete with open weights on one side and data owners on the other; data owners who also train models keep more of the margin. OVER’s LGM program is already running.
Of a physical-AI model’s three inputs — compute, research capability, and data — the first two can now be rented. Diverse, metric-scale data of real places cannot: it has to be accumulated over years, and that is the asset OVER holds.
OVER Research · info@ovr.ai
Section 08
What could break this
Objection 01Synthetic data substitutes for capture
Simulation engines are themselves trained on real data — Cosmos consumed 20 million hours of real video — and NVIDIA’s own data-factory blueprint pairs synthetic generation with real seeds, because simulation needs anchoring to limit the sim-to-real gap. On current evidence, synthetic data multiplies ground truth rather than replacing it, and digital twins of real places are its input.
Objection 02Web video is enough
V-JEPA 2 tested this at million-hour scale: representations were strong, but real robot data was still needed for control, and performance degraded off-distribution. Video without geometry, scale, and action labels captures how the world looks, but not how it responds to action. The scarce — and therefore priced — layer is the grounded one.
Objection 03Labs vertically integrate their own fleets
They are, which itself suggests data is the scarce input. But fleet data is single-embodiment and facility-bound, while generalization depends on environmental diversity — which is why the same labs also buy from external providers. Fleets and diverse-capture networks complement each other, and external networks are the part labs can buy.
Objection 04Timing, and DePIN incentive quality
Timing is the main residual risk. Two mitigants: data demand is already repricing, even at today’s small compute scales, and capture networks take years to build — a head start like Hivemapper’s three years is hard for a later entrant to close. On incentive quality, the failure mode is rewarding volume over quality; the mitigations are validation before rewards vest, demand-side burn, and reward curves tuned to what training actually consumes.
Appendix
Sources
- METR — Task-Completion Time Horizons of Frontier AI Models (updated May 8, 2026). metr.org/time-horizons
- METR — Time Horizon 1.1 (Jan 29, 2026); Kwa et al., arXiv:2503.14499. metr.org
- OfficeChai — Claude Mythos shows 50% time horizon of 16+ hours on METR (May 9, 2026). officechai.com
- Anthropic — Introducing Claude Fable 5 & Mythos 5 (Jun 2026). anthropic.com
- Google DeepMind — AlphaEvolve (May 2025). deepmind.google
- METR — RE-Bench (2024). arXiv:2411.15114
- MarkTechPost — Moonshot AI releases Kimi K3 (Jul 16, 2026). marktechpost.com
- Artificial Analysis — GDPval-AA v2 snapshots (Jul 16–17, 2026). artificialanalysis.ai
- Epoch AI — Open vs closed frontier gap; LLM inference price trends; a16z “LLMflation”. epoch.ai · a16z.com
- Epoch AI — Grok 4 training resources (~246M H100-hours, Sep 2025); models over 1e25 FLOP. epoch.ai
- Meta — Llama 3.1: 16,384 H100s; ~31M GPU-hours (Jul 2024). ai.meta.com
- NVIDIA — GR00T N1 (~50,000 H100-hours, 2025). arXiv:2503.14734
- Kim et al. — OpenVLA: 21,500 A100-hours, 64 GPUs, 27 epochs (2024). arXiv:2406.09246
- NVIDIA — Cosmos: 20M hours of video, 10,000 H100s × 3 months (Jan 2025). arXiv:2501.03575
- Epoch AI — Can AI scaling continue through 2030? (~500T indexed tokens). epoch.ai
- HuggingFace — FineWeb (15T tokens); Villalobos et al., arXiv:2211.04325. huggingface.co
- Meta — V-JEPA 2 (Jun 2025). arXiv:2506.09985
- Open X-Embodiment (2023). arXiv:2310.08864
- AgiBot World — 1M trajectories / 2,976 h / 100 robots (2025). arXiv:2503.06669
- DROID (2024), arXiv:2403.12945; RT-1 (2022), arXiv:2212.06817; Ego4D, ego4d-data.org
- Statista — 500+ hours uploaded to YouTube per minute. statista.com
- Survey — Training Data for Generalist Robot Foundation Models (2025): ~15M open episodes, 3–6 OOM below language/vision. researchgate.net
- Lin et al. — Data Scaling Laws in Imitation Learning (CoRL 2024). arXiv:2410.18647
- Latent.Space — “$2 H100s” (2024); IntuitionLabs H100 rental comparison (2026). latent.space · intuitionlabs.ai
- OpenAI — Stargate ($500B / 10 GW, Jan 2025); xAI Colossus; Meta Hyperion. openai.com
- NVIDIA — GTC 2026: Physical AI Data Factory blueprint (Mar 2026); Crunchbase — robotics VC $18.8B in 2026. blogs.nvidia.com · crunchbase.com
- Messari — State of DePIN 2025: 650+ projects, 8.8M active devices, $72M FY25 on-chain revenue, 10–25× revenue multiples; Helium ≈1M IoT hotspots (GridEcon/Solana case studies). messari.io · gridecon.com
- TechCrunch — Hivemapper at 2% of global roads / 1M unique km (Mar 2023); Google Street View 16.1M unique km, 2007–2019. techcrunch.com
- Hivemapper / Bee Maps — 20% of global roads in 18 months; ~⅓ today; 5× Street View pace; 100+ repeat passes (company-reported). beemaps.com · hivemapper.com
- TechCrunch — XDOF launches with $70M, ~20 customers incl. frontier labs (Jun 2026); General Intuition at $2.3B (Jun 2026); SVRC — teleop $136–340/hr (directional). techcrunch.com
- Tesla Q4-2025 earnings — 1,000+ Optimus units used primarily for data collection (Jan 2026). finance.yahoo.com
- OVER — live platform statistics; Map2Earn; OVRLand; VPS & TEE; LGM & robotics APIs (accessed Jul 17, 2026). overthereality.ai · HF dataset
- Forbes — Meta invests $14.3B in Scale AI at ~$29B (Jun 2025). forbes.com
- Bloomberg — Surge AI in talks at $25B+; $1.2B 2024 revenue (Jul 2025). bloomberg.com
- TechCrunch — Mercor: $10B (Oct 2025); talks at $20B (Jul 2026). techcrunch.com
- 2026 compute disclosures — VGGT: 64 A100 × 9 days (arXiv:2503.11651); MapAnything: 64 H200 × 10 days (arXiv:2509.13414); NVIDIA GR00T N1.7 model card, 30,720 GB200-hours (huggingface.co); Epoch AI — GPT-5 training-compute notes (epochai.substack.com).
- Dataset scales — nuPlan: 1,500 h (arXiv:2106.11810); Panda-70M: 70.7M clips / 167K h (Snap Research); 3D-FM mix components: ScanNet (arXiv:1702.04405), DL3DV-10K (arXiv:2312.16256), CO3D (arXiv:2109.00512), Aria Digital Twin (arXiv:2306.06362), per the VGGT/MapAnything training-data lists; ImageNet (image-net.org); LAION-5B (laion.ai); InternVid ~760K h (2023).
OVER RESEARCH · JULY 2026 · v3 · Informational only; not investment advice or an offer of securities. Figures as of July 17, 2026; derived figures are marked in chart notes; deals described as “talks” were unclosed at publication; Hivemapper coverage figures beyond March 2023 are company-reported. Time-horizon projections are naive extrapolations of METR-measured trends, not METR forecasts.
© 2026 OVER · overthereality.ai · info@ovr.ai